Visit Website   |   Get Newsletter in your inbox   |   Subscription & Services  

OSS Nightly Indicators


Newsletter is free to the public on Thursday evenings for trading Friday.

OSS SUBSCRIPTIONS

Cycle charts are showing a low in the Indexes in 1 to 3 weeks. The IWM is likely to see a Bearish Wave 5, and we now have one the overexdented indicators has triggered a Bearish signal twice in the last week.

The IWM has formed a Bearish Flag.

The Calendar chart is showing a move lower from the 4th to the 7th.


PAST PERFORMANCE


NEWS

  • Bitcoin L2s set to explode as Runes congest BTC network (cointelegraph.com) Click Here
  • Bitcoin price correction ‘very common’ if $56K lows hold — Peter Brandt (cointelegraph.com) Click Here
  • Coinbase Announces Support for Bitcoin's Lightning Network – Exchanges Bitcoin News Click Here
  • Stock Market Today: S&P 500 closes higher as tech leads charge; jobs report eyed By Investing.com Click Here
  • These are the top buys and sells for May, according to our predictive AI By Investing.com Click Here
  • US Dollar Explodes: What it Means for Gold | ZeroHedge Click Here

Follow me at:

Twitter | FaceBook | StockTwits


RESULTS FOR THE PREVIOUS TRADING DAY.

MAJOR
Symbol Last Chg. Chg. %
.DJI 38225.66 $322.37 0.85%
.DJT 15234.6 $370.00 2.49%
.NDX 17541.54 $222.99 1.29%
GBTC_OLD.PK 40.35 $0.00 0.00%
GLD 213.12 ($0.67) -0.31%
IWM 199.98 $3.67 1.87%
SLV 24.37 $0.10 0.41%
SPY 505.01 $4.66 0.93%
TLT.O 88.91 $0.35 0.40%
UNG 14.86 $0.72 5.09%
US500 5064.2 $45.81 0.91%
USO 75.92 ($0.01) -0.01%
UUP 28.73 ($0.21) -0.74%
GLD 181.4 ($0.78) -0.43%

SECTORS
Symbol Last Chg. Chg. %
RWR 88.62 $1.45 1.66%
XBI 88.39 $1.06 1.21%
XHB 103.57 $1.38 1.35%
XLB 88.65 ($0.44) -0.49%
XLE 92.56 $0.53 0.58%
XLF 40.46 $0.10 0.25%
XLI 121.93 $0.71 0.59%
XLK 197.06 $2.80 1.44%
XLP 75.64 $0.62 0.83%
XLU 67.87 $0.36 0.53%
XLV 140.51 ($0.07) -0.05%
XLY 176.76 $2.24 1.28%
XRT 72.54 $1.26 1.77%

CRYPTOS
Symbol Last Chg. Chg. %
ADA 0.4559 $0.01 3.17%
BAT 0.242 $0.01 4.04%
BCH 429.9 $16.50 3.99%
BSV 59.4 $1.29 2.22%
BTC 59358 $2,157.00 3.77%
DGB 0.010966 $0.00 5.65%
DOGE 0.072991 $0.00 0.34%
ETH 2993.36 $65.34 2.23%
ETN 0.003254 $0.00 0.00%
LTC 80.47 $1.78 2.26%
SHIB 0.00002303 $0.00 4.82%
THETA 2.038 $0.07 3.40%
TRX 0.12274 $0.00 2.55%
XLM 0.0939 $0.01 10.86%
XRP 0.5227 $0.01 2.35%

FOREX
Symbol Last Chg. Chg. %
AUD/CHF 0.5976 $0.000 0.05%
AUD/JPY 100.7 ($0.170) -0.17%
EUR/AUD 1.6343 ($0.008) -0.49%
EUR/CHF 0.9766 ($0.005) -0.46%
EUR/GBP 0.8557 $0.001 0.06%
EUR/USD 1.0728 $0.002 0.18%
GBP/AUD 1.9099 ($0.011) -0.56%
GBP/CHF 1.1412 ($0.006) -0.51%
GBP/JPY 192.32 ($1.340) -0.69%
GBP/USD 1.2537 $0.001 0.10%
USD/CAD 1.3676 ($0.006) -0.45%
USD/CHF 0.9104 ($0.005) -0.54%
USD/JPY 153.4 ($1.080) -0.70%
EUR/JPY 164.58 ($0.960) -0.58%
AUD/USD 0.6564 $0.004 0.63%


TECHNICAL INDICATORS FOR THE PREVIOUS TRADING DAY.

Bullish TA
428102New 52-week Highs
16833Strong Volume Gainers
28-7Bullish 50/200-day MA Crossovers
37159Bullish MACD Crossovers
248Oversold with an Improving RSI
528262Moved Above Upper Bollinger Band
533244Moved Above Upper Price Channel
376218Moved Above Upper Keltner Channel
1388Improving Chaikin Money Flow
675339New CCI Buy Signals
433-70Parabolic SAR Buy Signals
107-24Stocks in a New Uptrend (Aroon)
14249Stocks in a New Uptrend (ADX)
12129Gap Ups
154Breakaway Gap Ups
5131Runaway Gap Ups
10Island Bottoms
Bearish TA
122-32New 52-week Lows
94-20Strong Volume Decliners
15-12Bearish 50/200-day MA Crossovers
123-64Bearish MACD Crossovers
14-12Overbought with a Declining RSI
147-82Moved Below Lower Bollinger Band
180-133Moved Below Lower Price Channel
113-52Moved Below Lower Keltner Channel
127-264Declining Chaikin Money Flow
296-173New CCI Sell Signals
341-182Parabolic SAR Sell Signals
176-94Stocks in a New Downtrend (Aroon)
66-1Stocks in a New Downtrend (ADX)
94-29Gap Downs
10-8Breakaway Gap Downs
28-6Runaway Gap Downs
22Island Tops
Bullish Reversals
60-69Bullish Engulfing
1-25Piercing Line
119Morning Star
18-48Bullish Harami
109Three White Soldiers
Bearish Reversals
910Bearish Engulfing
111Dark Cloud Cover
1-3Evening Star
21-36Bearish Harami
120Three Black Crows


*** For Subscribers Only ***

REVERSAL SIGNALS


Matrix last updated on:5/2/2024


  • Beginning of the week is Bearish. Latter part is Bullish.
  • Major astrological aspects are pointing to a reversal in trend.
  • Cycle charts are showing a bottom this week.
  • 4/29/24 -- NOAA's updated forecast shows more Bearish energy in the middle of the week.
  • 5/1/24 -- Mixed energies today and tomorrow.
  • 5/1/24 -- Thursday has the highest Bullish energy for the week, but also has the worst NOAA forecast. I am leaning Bullish.

It can take some work to interpret the Weekly Matrix.
To make it easier to understand, I have created the Matrix Summary below.


CYCLE FORECASTS


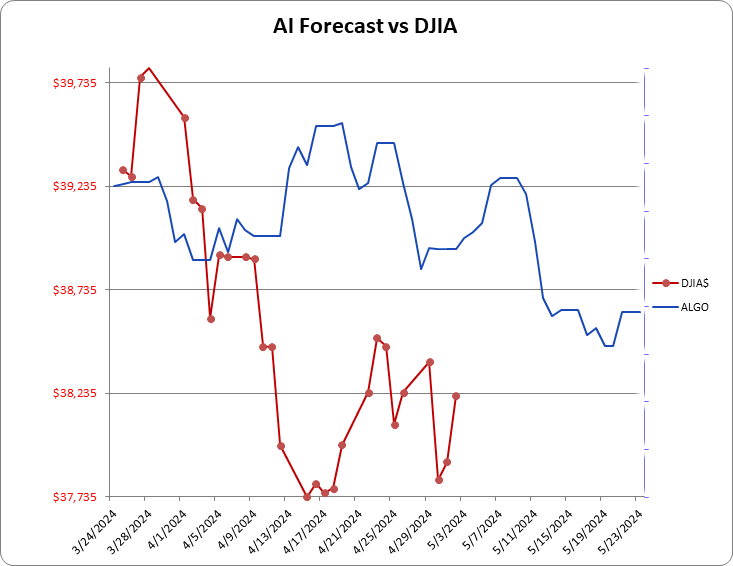
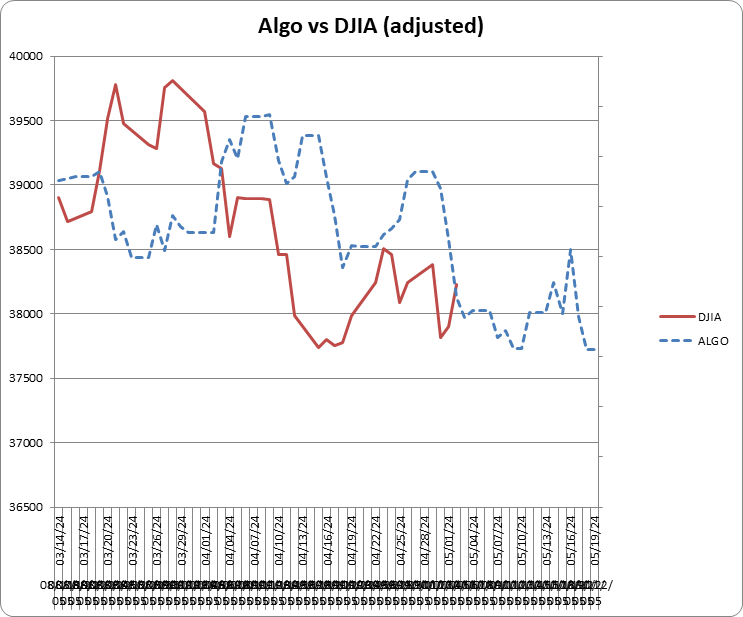
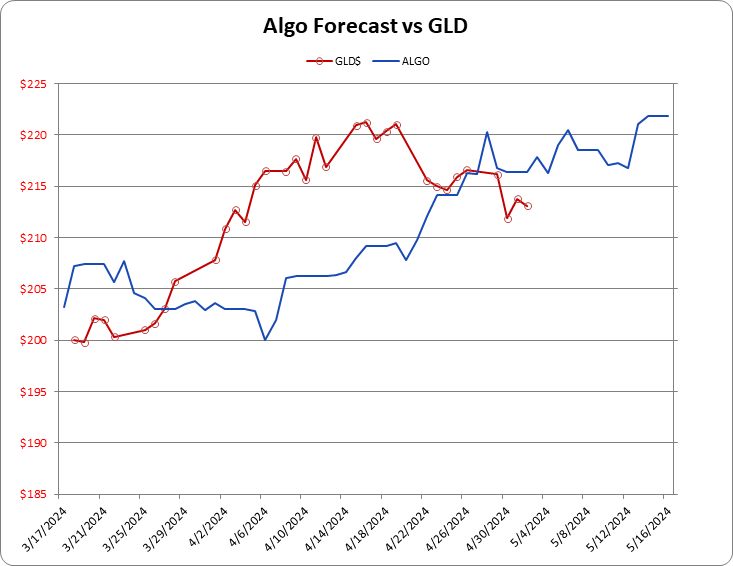
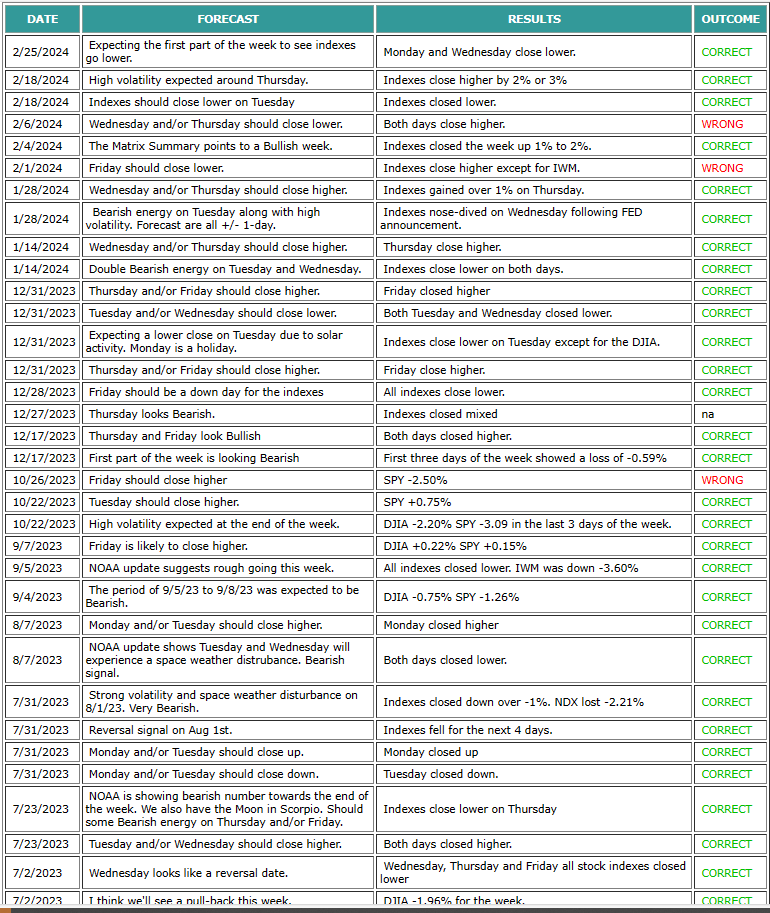
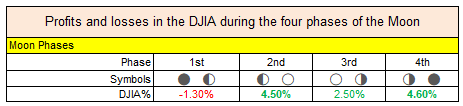
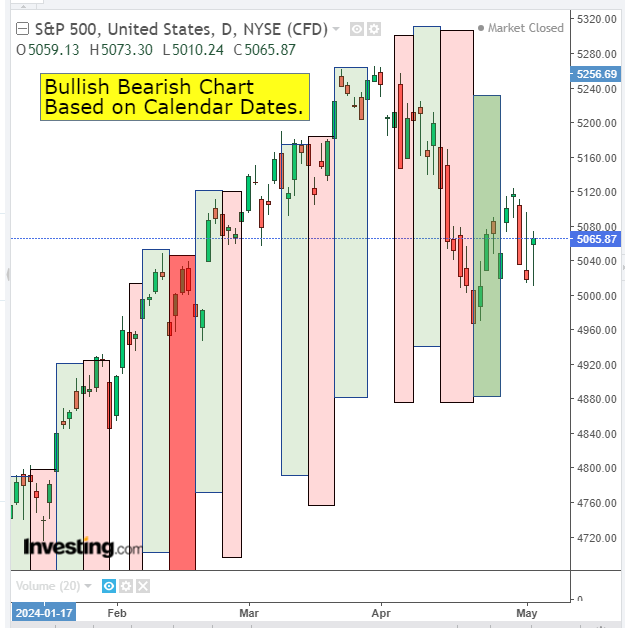
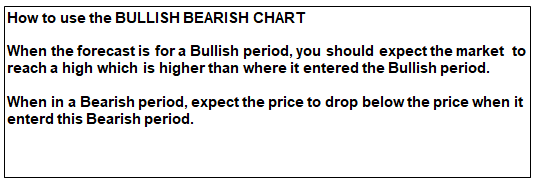
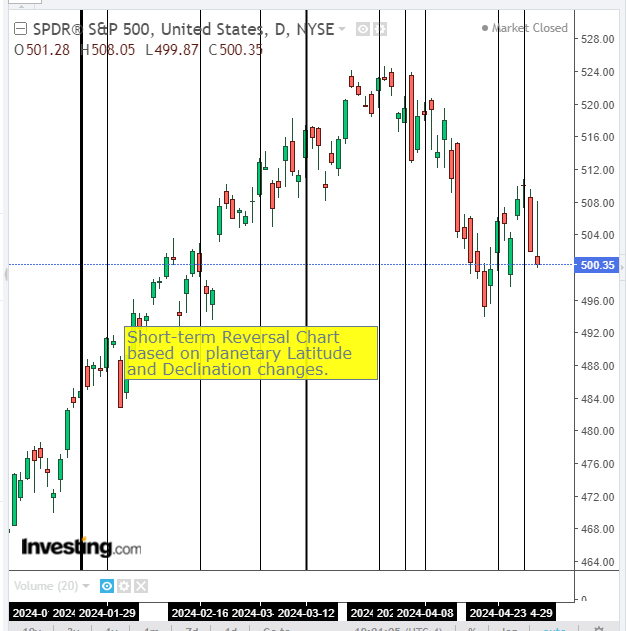
HYPOTHETICAL PERFORMANCE RESULTS HAVE MANY INHERENT LIMITATIONS, SOME OF WHICH ARE DESCRIBED BELOW. NO REPRESENTATION IS BEING MADE THAT ANY ACCOUNT WILL OR IS LIKELY TO ACHIEVE PROFITS OR LOSSES SIMILAR TO THOSE SHOWN; IN FACT, THERE ARE FREQUENTLY SHARP DIFFERENCES BETWEEN HYPOTHETICAL PERFORMANCE RESULTS AND THE ACTUAL RESULTS AND THE ACTUAL RESULTS SUBSEQUENTLY ACHIEVED BY ANY PARTICULAR TRADING PROGRAM. ONE OF THE LIMITATIONS OF HYPOTHETICAL PERFORMANCE RESULTS IS THAT THEY ARE GENERALLY PREPARED WITH THE BENEFIT OF HINDSIGHT. IN ADDITION, HYPOTHETICAL TRADING DOES NOT INVOLVE FINANCIAL RISK, AND NO HYPOTHETICAL TRADING RECORD CAN COMPLETELY ACCOUNT FOR THE IMPACT OF FINANCIAL RISK OF ACTUAL TRADING. FOR EXAMPLE, THE ABILITY TO WITHSTAND LOSSES OR TO ADHERE TO A PARTICULAR TRADING PROGRAM IN SPITE OF TRADING LOSSES ARE MATERIAL POINTS WHICH CAN ALSO ADVERSELY AFFECT ACTUAL TRADING RESULTS. THERE ARE NUMEROUS OTHER FACTORS RELATED TO THE MARKETS IN GENERAL OR TO THE IMPLEMENTATION OF ANY SPECIFIC TRADING PROGRAM WHICH CANNOT BE FULLY ACCOUNTED FOR IN THE PREPARATION OF HYPOTHETICAL PERFORMANCE RESULTS AND ALL WHICH CAN ADVERSELY AFFECT TRADING RESULTS.

Futures trading is complex and carries the risk of substantial losses. It is not suitable for all investors. The ability to withstand losses and to adhere to a particular trading program in spite of trading losses are material points which can adversely affect investor returns.