OSS Nightly Indicators
|
Today's forecast was for a higher move which the indexes did do but finished lower.
April looks like trouble. Psychics, astrologers, remote viewers and others who peer into the future
are claiming April will be a tough month to get through. There are reports of problems in the financial
markets and violence in the geopolitical world. Joni Patry is reporting possible danger for not only Trump but
other members of his family. Checkout her recent video here: Click Here
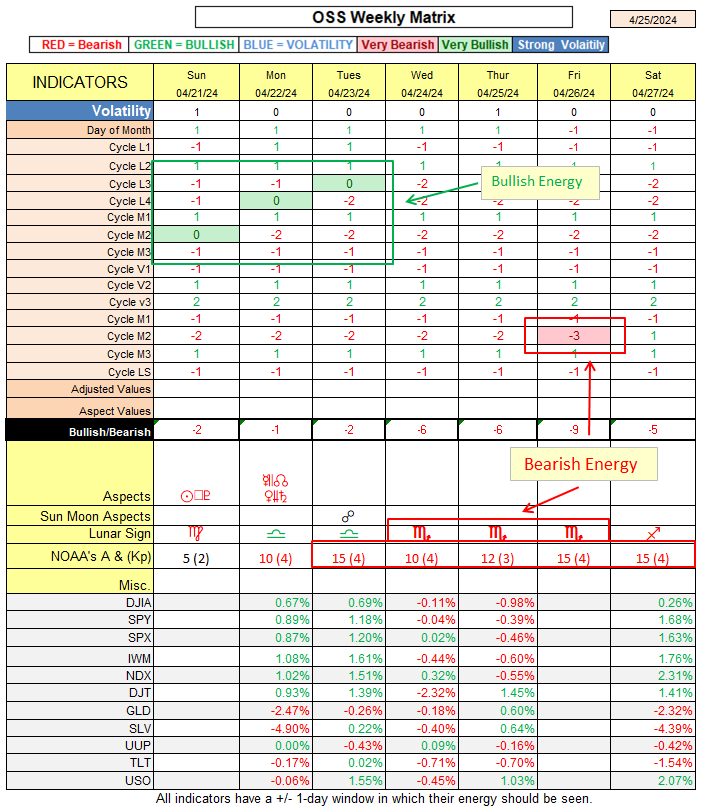
Trump's tariffs have become it own indicator and looks like it will continue to negate the Algo forecast.
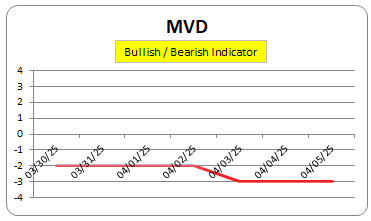
The MVD Indicator will be at a Bearish -3 all week.
|
NEWS
- Is China dumping US treasuries? By Investing.com Click Here
- U.S. to move forward with sweeping 104% tariff on China, official confirms By Investing.com Click Here
- Stock Market Today: S&P 500 ends below 5,000 in ugly reversal on trade war angst By Investing.com Click Here
- Bitcoin weekly RSI hits bull market low as trader sees $70K BTC price bottom Click Here
- Gold: Deutsche Bank Cites "Risks to USD Reserve Status", Ups Target to $3,350 | ZeroHedge Click Here
- Micron Prepares To Slap Tariff-Related Charge On Customers | ZeroHedge Click Here
Follow me at:
Twitter | FaceBook | StockTwits
BTC - ETH Profit Ratio
We expect the crypto rally to continue until ETH percentage profits are 2x that of BTC
We will use Sept 6th, 2024 as the beginning of the rally, and tracking the daily change in the Subscriber section.
|
CLOSING PRICES
| MAJOR |
| Symbol |
Last |
Chg. |
Chg. % |
| .DJI |
37645.59 |
($320.01) |
-0.84% |
| .DJT |
12637 |
($347.40) |
-2.68% |
| GBTC.K |
60.61 |
($0.98) |
-1.59% |
| GLD |
275.2 |
$1.49 |
0.54% |
| IWM |
174.83 |
($4.72) |
-2.63% |
| QQQ.O |
416.06 |
($7.63) |
-1.80% |
| SLV |
27.14 |
$0.00 |
0.00% |
| SPY |
496.68 |
($7.70) |
-1.53% |
| TLT.O |
88.35 |
($1.70) |
-1.89% |
| UNG |
18.28 |
($0.79) |
-4.14% |
| US500 |
4982.78 |
($79.47) |
-1.57% |
| USO |
63.36 |
($2.62) |
-3.97% |
| UUP |
28.25 |
($0.14) |
-0.48% |
|
| SECTORS |
| Symbol |
Last |
Chg. |
Chg. % |
| RWR |
86.33 |
($2.22) |
-2.51% |
| XBI |
69.8 |
($3.19) |
-4.37% |
| XHB |
86.79 |
($3.20) |
-3.56% |
| XLB |
74.27 |
($2.36) |
-3.08% |
| XLE |
76.44 |
($1.81) |
-2.31% |
| XLF |
43.92 |
($0.17) |
-0.39% |
| XLI |
116.42 |
($0.97) |
-0.83% |
| XLK |
179.73 |
($3.73) |
-2.03% |
| XLP |
76.36 |
($1.19) |
-1.53% |
| XLU |
73.09 |
($0.30) |
-0.41% |
| XLV |
132.98 |
($1.49) |
-1.11% |
| XLY |
176.38 |
($4.25) |
-2.35% |
| XRT |
62.11 |
($2.42) |
-3.75% |
|
| CRYPTOS |
| Symbol |
Last |
Chg. |
Chg. % |
| ADA |
0.5598 |
($0.03) |
-4.71% |
| BAT |
0.1139 |
($0.01) |
-4.53% |
| BCH |
270.2 |
($6.40) |
-2.31% |
| BCHSV |
25.97 |
($1.34) |
-4.91% |
| BTC |
76922 |
($2,259.00) |
-2.85% |
| DGB |
0.009424 |
$0.00 |
0.04% |
| DOGE |
0.072991 |
$0.00 |
0.34% |
| ETH |
1470.32 |
($98.13) |
-6.26% |
| HBAR |
0.14917 |
$0.00 |
-1.15% |
| LTC |
69.38 |
($2.43) |
-3.38% |
| NEAR |
1.889 |
($0.23) |
-10.94% |
| SHIB |
0.0000106 |
$0.00 |
-7.34% |
| THETA |
0.69 |
($0.03) |
-4.03% |
| XLM |
0.0939 |
$0.01 |
10.86% |
| XRP |
1.8019 |
($0.11) |
-5.69% |
|
| FOREX |
| Symbol |
Last |
Chg. |
Chg. % |
| AUD/CHF |
0.5049 |
$0.000 |
-0.06% |
| AUD/JPY |
87.22 |
$0.080 |
0.09% |
| EUR/AUD |
1.8395 |
$0.000 |
0.01% |
| EUR/CHF |
0.9283 |
($0.001) |
-0.11% |
| EUR/GBP |
0.8579 |
$0.000 |
0.03% |
| EUR/USD |
1.0951 |
($0.001) |
-0.06% |
| GBP/AUD |
2.1422 |
$0.000 |
-0.02% |
| GBP/CHF |
1.0825 |
($0.001) |
-0.07% |
| GBP/JPY |
186.79 |
$0.100 |
0.05% |
| GBP/USD |
1.2767 |
$0.000 |
0.03% |
| USD/CAD |
1.4265 |
$0.000 |
0.01% |
| USD/CHF |
0.8472 |
($0.001) |
-0.08% |
| USD/JPY |
146.32 |
$0.060 |
0.04% |
| EUR/JPY |
160.31 |
$0.010 |
0.01% |
| AUD/USD |
0.5959 |
$0.000 |
-0.05% |
|
TECHNICAL INDICATORS FOR THE PREVIOUS TRADING DAY.
| Bullish TA |
| 700 | 259 | New 52-week Highs |
| 109 | -48 | Strong Volume Gainers |
| 22 | -7 | Bullish 50/200-day MA Crossovers |
| 402 | 140 | Bullish MACD Crossovers |
| 23 | 10 | Oversold with an Improving RSI |
| 484 | 78 | Moved Above Upper Bollinger Band |
| 588 | 174 | Moved Above Upper Price Channel |
| 369 | 53 | Moved Above Upper Keltner Channel |
| 170 | 4 | Improving Chaikin Money Flow |
| 955 | 503 | New CCI Buy Signals |
| 718 | 431 | Parabolic SAR Buy Signals |
| 199 | 10 | Stocks in a New Uptrend (Aroon) |
| 129 | 24 | Stocks in a New Uptrend (ADX) |
| 133 | 48 | Gap Ups |
| 14 | 13 | Breakaway Gap Ups |
| 33 | 13 | Runaway Gap Ups |
| 1 | -3 | Island Bottoms |
|
| Bearish TA |
| 160 | -143 | New 52-week Lows |
| 44 | -47 | Strong Volume Decliners |
| 21 | -5 | Bearish 50/200-day MA Crossovers |
| 120 | -50 | Bearish MACD Crossovers |
| 15 | -2 | Overbought with a Declining RSI |
| 96 | -130 | Moved Below Lower Bollinger Band |
| 130 | -183 | Moved Below Lower Price Channel |
| 89 | -117 | Moved Below Lower Keltner Channel |
| 91 | -40 | Declining Chaikin Money Flow |
| 238 | -310 | New CCI Sell Signals |
| 190 | -229 | Parabolic SAR Sell Signals |
| 99 | -143 | Stocks in a New Downtrend (Aroon) |
| 51 | -22 | Stocks in a New Downtrend (ADX) |
| 78 | -22 | Gap Downs |
| 2 | -2 | Breakaway Gap Downs |
| 24 | -1 | Runaway Gap Downs |
| 0 | 0 | Island Tops |
|
| Bullish Reversals |
| 87 | -43 | Bullish Engulfing |
| 6 | -15 | Piercing Line |
| 10 | 10 | Morning Star |
| 8 | -15 | Bullish Harami |
| 1 | 0 | Three White Soldiers |
|
| Bearish Reversals |
| 135 | 43 | Bearish Engulfing |
| 23 | 5 | Dark Cloud Cover |
| 1 | -1 | Evening Star |
| 39 | -13 | Bearish Harami |
| 3 | -17 | Three Black Crows |
|

|
|
HYPOTHETICAL PERFORMANCE RESULTS HAVE MANY INHERENT LIMITATIONS, SOME OF WHICH ARE DESCRIBED BELOW. NO REPRESENTATION IS BEING MADE THAT ANY ACCOUNT WILL OR IS LIKELY TO ACHIEVE PROFITS OR LOSSES SIMILAR TO THOSE SHOWN; IN FACT, THERE ARE FREQUENTLY SHARP DIFFERENCES BETWEEN HYPOTHETICAL PERFORMANCE RESULTS AND THE ACTUAL RESULTS AND THE ACTUAL RESULTS SUBSEQUENTLY ACHIEVED BY ANY PARTICULAR TRADING PROGRAM. ONE OF THE LIMITATIONS OF HYPOTHETICAL PERFORMANCE RESULTS IS THAT THEY ARE GENERALLY PREPARED WITH THE BENEFIT OF HINDSIGHT. IN ADDITION, HYPOTHETICAL TRADING DOES NOT INVOLVE FINANCIAL RISK, AND NO HYPOTHETICAL TRADING RECORD CAN COMPLETELY ACCOUNT FOR THE IMPACT OF FINANCIAL RISK OF ACTUAL TRADING. FOR EXAMPLE, THE ABILITY TO WITHSTAND LOSSES OR TO ADHERE TO A PARTICULAR TRADING PROGRAM IN SPITE OF TRADING LOSSES ARE MATERIAL POINTS WHICH CAN ALSO ADVERSELY AFFECT ACTUAL TRADING RESULTS. THERE ARE NUMEROUS OTHER FACTORS RELATED TO THE MARKETS IN GENERAL OR TO THE IMPLEMENTATION OF ANY SPECIFIC TRADING PROGRAM WHICH CANNOT BE FULLY ACCOUNTED FOR IN THE PREPARATION OF HYPOTHETICAL PERFORMANCE RESULTS AND ALL WHICH CAN ADVERSELY AFFECT TRADING RESULTS. Futures trading is complex and carries the risk of substantial losses. It is not suitable for all investors. The ability to withstand losses and to adhere to a particular trading program in spite of trading losses are material points which can adversely affect investor returns.
|

|


-20250408.png)


-20250408.png)