Visit Website   |   Get Newsletter in your inbox   |   Subscription & Services  

OSS Nightly Indicators


04/22/25 -- NEW Indicator for paid subscribers, but will post in the free newsletter also for the next 30 days: The SPY Reversal Indicator. See below.

April looks like trouble. Psychics, astrologers, remote viewers and others who peer into the future are claiming April will be a tough month to get through. There are reports of problems in the financial markets and violence in the geopolitical world. Joni Patry is reporting possible danger for not only Trump but other members of his family. Checkout her recent video here: Click Here

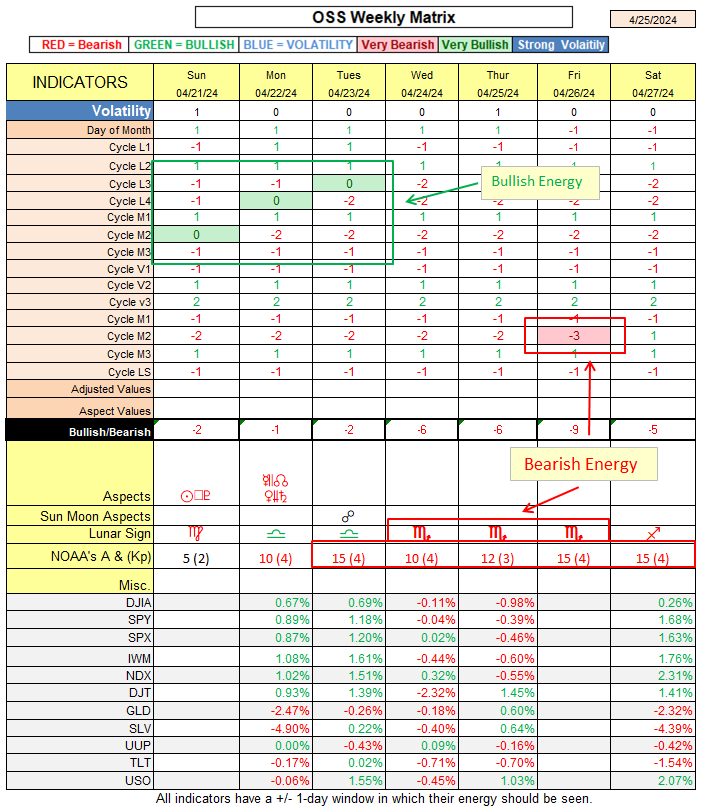
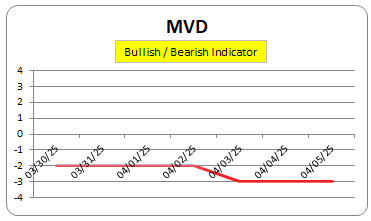
The MVD Indicator grows more bullish as the week advances

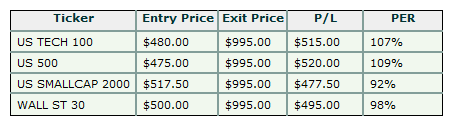
The Matrix was Bullish for Thursday, and the Confidence Indicator was also very high, so we bought Binary options on all four of the Indexes listed on Nadex.com.


NEWS

  • Bitcoin supply on exchanges is falling ‘due to public company purchases’ — Fidelity Click Here
  • Bitcoin Steady at $93K as Battle With Gold Ensues – Markets and Prices Bitcoin News Click Here
  • Alphabet delivers blowout Q1 earnings on strength in search, cloud units By Investing.com Click Here
  • Stock market today: S&P 500 rallies out of correction as tech flexes muscles By Investing.com Click Here
  • A couple of Fed heads hint at rate cuts By Investing.com Click Here
  • Goldman Sachs predicts further fall for battered U.S. dollar By Investing.com Click Here

Follow me at:

Twitter | FaceBook | StockTwits


BTC - ETH Profit Ratio

We expect the crypto rally to continue until ETH percentage profits are 2x that of BTC

We will use Sept 6th, 2024 as the beginning of the rally, and tracking the daily change in the Subscriber section.


CLOSING PRICES

MAJOR
Symbol Last Chg. Chg. %
.DJI 40093.4 $486.83 1.23%
.DJT 13761.6 $252.10 1.87%
GBTC.K 73.92 $0.08 0.10%
GLD 308.07 $4.42 1.46%
IWM 194.06 $3.81 2.00%
QQQ.O 467.35 $12.79 2.81%
SLV 30.56 ($0.01) -0.02%
SPY 546.48 $11.06 2.07%
TLT.O 88.24 $0.92 1.05%
UNG 15.5 ($0.23) -1.46%
US500 5484.78 $108.92 2.03%
USO 68.46 $0.41 0.60%
UUP 27.32 ($0.13) -0.46%

SECTORS
Symbol Last Chg. Chg. %
RWR 94.98 $0.33 0.35%
XBI 80.89 $1.79 2.26%
XHB 94.35 $2.30 2.50%
XLB 83.24 $1.76 2.16%
XLE 82.54 $1.30 1.60%
XLF 48.24 $0.52 1.09%
XLI 128.99 $2.80 2.22%
XLK 205.43 $7.39 3.73%
XLP 81.05 ($0.72) -0.88%
XLU 78.45 $0.12 0.15%
XLV 137.39 $1.66 1.22%
XLY 194.07 $3.75 1.97%
XRT 68.46 $1.11 1.65%

CRYPTOS
Symbol Last Chg. Chg. %
ADA 0.7167 $0.02 2.17%
BAT 0.1443 $0.00 2.20%
BCH 351.3 ($7.40) -2.06%
BCHSV 30.77 ($0.05) -0.16%
BTC 93559 ($162.00) -0.17%
DGB 0.010256 $0.00 -2.00%
DOGE 0.072991 $0.00 0.34%
ETH 1763.48 ($39.50) -2.19%
HBAR 0.18731 $0.01 3.35%
LTC 83.82 $0.43 0.52%
NEAR 2.54 $0.06 2.21%
SHIB 0.00001362 $0.00 0.89%
THETA 0.711 $0.02 3.19%
XLM 0.0939 $0.01 10.86%
XRP 2.1989 ($0.03) -1.39%

FOREX
Symbol Last Chg. Chg. %
AUD/CHF 0.5303 $0.000 0.06%
AUD/JPY 91.49 $0.050 0.05%
EUR/AUD 1.7766 $0.000 -0.02%
EUR/CHF 0.9421 $0.000 0.03%
EUR/GBP 0.8537 $0.000 0.01%
EUR/USD 1.1386 $0.000 -0.03%
GBP/AUD 2.0812 $0.000 -0.02%
GBP/CHF 1.1035 $0.000 0.02%
GBP/JPY 190.39 $0.010 0.01%
GBP/USD 1.3338 $0.000 0.01%
USD/CAD 1.3852 $0.001 0.05%
USD/CHF 0.8274 $0.000 0.02%
USD/JPY 142.75 $0.090 0.06%
EUR/JPY 162.54 $0.110 0.07%
AUD/USD 0.6409 $0.001 0.14%


TECHNICAL INDICATORS FOR THE PREVIOUS TRADING DAY.

Bullish TA
700259New 52-week Highs
109-48Strong Volume Gainers
22-7Bullish 50/200-day MA Crossovers
402140Bullish MACD Crossovers
2310Oversold with an Improving RSI
48478Moved Above Upper Bollinger Band
588174Moved Above Upper Price Channel
36953Moved Above Upper Keltner Channel
1704Improving Chaikin Money Flow
955503New CCI Buy Signals
718431Parabolic SAR Buy Signals
19910Stocks in a New Uptrend (Aroon)
12924Stocks in a New Uptrend (ADX)
13348Gap Ups
1413Breakaway Gap Ups
3313Runaway Gap Ups
1-3Island Bottoms
Bearish TA
160-143New 52-week Lows
44-47Strong Volume Decliners
21-5Bearish 50/200-day MA Crossovers
120-50Bearish MACD Crossovers
15-2Overbought with a Declining RSI
96-130Moved Below Lower Bollinger Band
130-183Moved Below Lower Price Channel
89-117Moved Below Lower Keltner Channel
91-40Declining Chaikin Money Flow
238-310New CCI Sell Signals
190-229Parabolic SAR Sell Signals
99-143Stocks in a New Downtrend (Aroon)
51-22Stocks in a New Downtrend (ADX)
78-22Gap Downs
2-2Breakaway Gap Downs
24-1Runaway Gap Downs
00Island Tops
Bullish Reversals
87-43Bullish Engulfing
6-15Piercing Line
1010Morning Star
8-15Bullish Harami
10Three White Soldiers
Bearish Reversals
13543Bearish Engulfing
235Dark Cloud Cover
1-1Evening Star
39-13Bearish Harami
3-17Three Black Crows


*** For Subscribers Only ***

COMMENTS


    Matrix last updated on:4/24/2025

    • 04/20/25 -- MVD indicator gets more bullish towards the end of the week. On Friday it hits 4 which is the most bullish it can get.
    • 04/20/25 -- I think the markets are putting in a wave 4 which means a wave 5 is coming sometime in the next 2-3 weeks.
    • 04/22/25 -- If tomorrow closes higher we'll need to shift the summary back one day and expect another close higher on Thursday.
    • 04/23/25 -- The Matrix Summary forecast have been moved back one day. A higher close is expected on Thursday and maybe Friday as well.

    It can take some work to interpret the Weekly Matrix.
    To make it easier to understand, I have created the Matrix Summary below.


    CYCLE FORECASTS


    HYPOTHETICAL PERFORMANCE RESULTS HAVE MANY INHERENT LIMITATIONS, SOME OF WHICH ARE DESCRIBED BELOW. NO REPRESENTATION IS BEING MADE THAT ANY ACCOUNT WILL OR IS LIKELY TO ACHIEVE PROFITS OR LOSSES SIMILAR TO THOSE SHOWN; IN FACT, THERE ARE FREQUENTLY SHARP DIFFERENCES BETWEEN HYPOTHETICAL PERFORMANCE RESULTS AND THE ACTUAL RESULTS AND THE ACTUAL RESULTS SUBSEQUENTLY ACHIEVED BY ANY PARTICULAR TRADING PROGRAM. ONE OF THE LIMITATIONS OF HYPOTHETICAL PERFORMANCE RESULTS IS THAT THEY ARE GENERALLY PREPARED WITH THE BENEFIT OF HINDSIGHT. IN ADDITION, HYPOTHETICAL TRADING DOES NOT INVOLVE FINANCIAL RISK, AND NO HYPOTHETICAL TRADING RECORD CAN COMPLETELY ACCOUNT FOR THE IMPACT OF FINANCIAL RISK OF ACTUAL TRADING. FOR EXAMPLE, THE ABILITY TO WITHSTAND LOSSES OR TO ADHERE TO A PARTICULAR TRADING PROGRAM IN SPITE OF TRADING LOSSES ARE MATERIAL POINTS WHICH CAN ALSO ADVERSELY AFFECT ACTUAL TRADING RESULTS. THERE ARE NUMEROUS OTHER FACTORS RELATED TO THE MARKETS IN GENERAL OR TO THE IMPLEMENTATION OF ANY SPECIFIC TRADING PROGRAM WHICH CANNOT BE FULLY ACCOUNTED FOR IN THE PREPARATION OF HYPOTHETICAL PERFORMANCE RESULTS AND ALL WHICH CAN ADVERSELY AFFECT TRADING RESULTS.

    Futures trading is complex and carries the risk of substantial losses. It is not suitable for all investors. The ability to withstand losses and to adhere to a particular trading program in spite of trading losses are material points which can adversely affect investor returns.